- Platform
-
-
- Menu Item
 Visual Development
Use our intuitive, visual drag-and-drop interface to build powerful business apps for automation, decision-making and customer service.
- Data Modeling
Model data structures of any complexity. Organize them into fields of various types, nested structures, arrays, and maps. Serialize as JSON, XML or other/custom markup.
- Integration
Utilize built-in connector library to quickly connect ProcessMIX applications to databases, REST/SOAP web services, Amazon S3, Kafka messaging or blockchain.
- Decision Tables
Author complex business logic and manage large number of rules easily in a tabular format.
- Scorecards
Apply predictive analytics and lower risk by incorporating scoring models into your decision strategies with the help of our scorecard model editor.
- PMML
Import and execute Predictive Modeling Markup Language (PMML) models to add the power of data mining and AI to your solutions.
- Version Control
Manage complex development projects more effectively with ProcessMIX version control system, complete with code change monitoring, version history, branching and dev team collaboration.
- Debugging and Testing
Build more robust solutions and troubleshoot easily with our testing and debugging tools, including step-by-step execution, performance monitoring, unit tests and automatic log collection.
- Deployment and Execution
Use ProcessMIX to deploy REST/SOAP API or scheduled jobs to the cloud with a single click. Leverage built-in Docker packaging, Kubernetes service generation and AWS cloud support. Alternatively, export projects as JAR/WAR packages or Java source code for on-premise deployment or to fit your own software deployment strategy.
- Menu Item
-
-
- Solutions
 Visual Development
 Assignment of risk level and customer category within KYC processes during customer onboarding
 Cross-sell offer calculation for a 12MM strong client portfolio
Requests logs
Request Logs is a section where you can view all execution results of a flow for REST, SOAP, and scheduled channels. Logs of REST and SOAP channels are displayed not only after external calls but also following the use of Test Helper calls. Scheduled channel logs are visible after execution. However, logs for subflows are not collected here.
Logs can be viewed in two sections: Home and IDE.
Organizations with a free subscription plan cannot view request logs in Home, because the free plan doesn’t include any environment.
The Request Logs section in Home is available to owners and administrators only.
IDE Logs panel allows you to view logs specifically related to the project you’re currently working on.
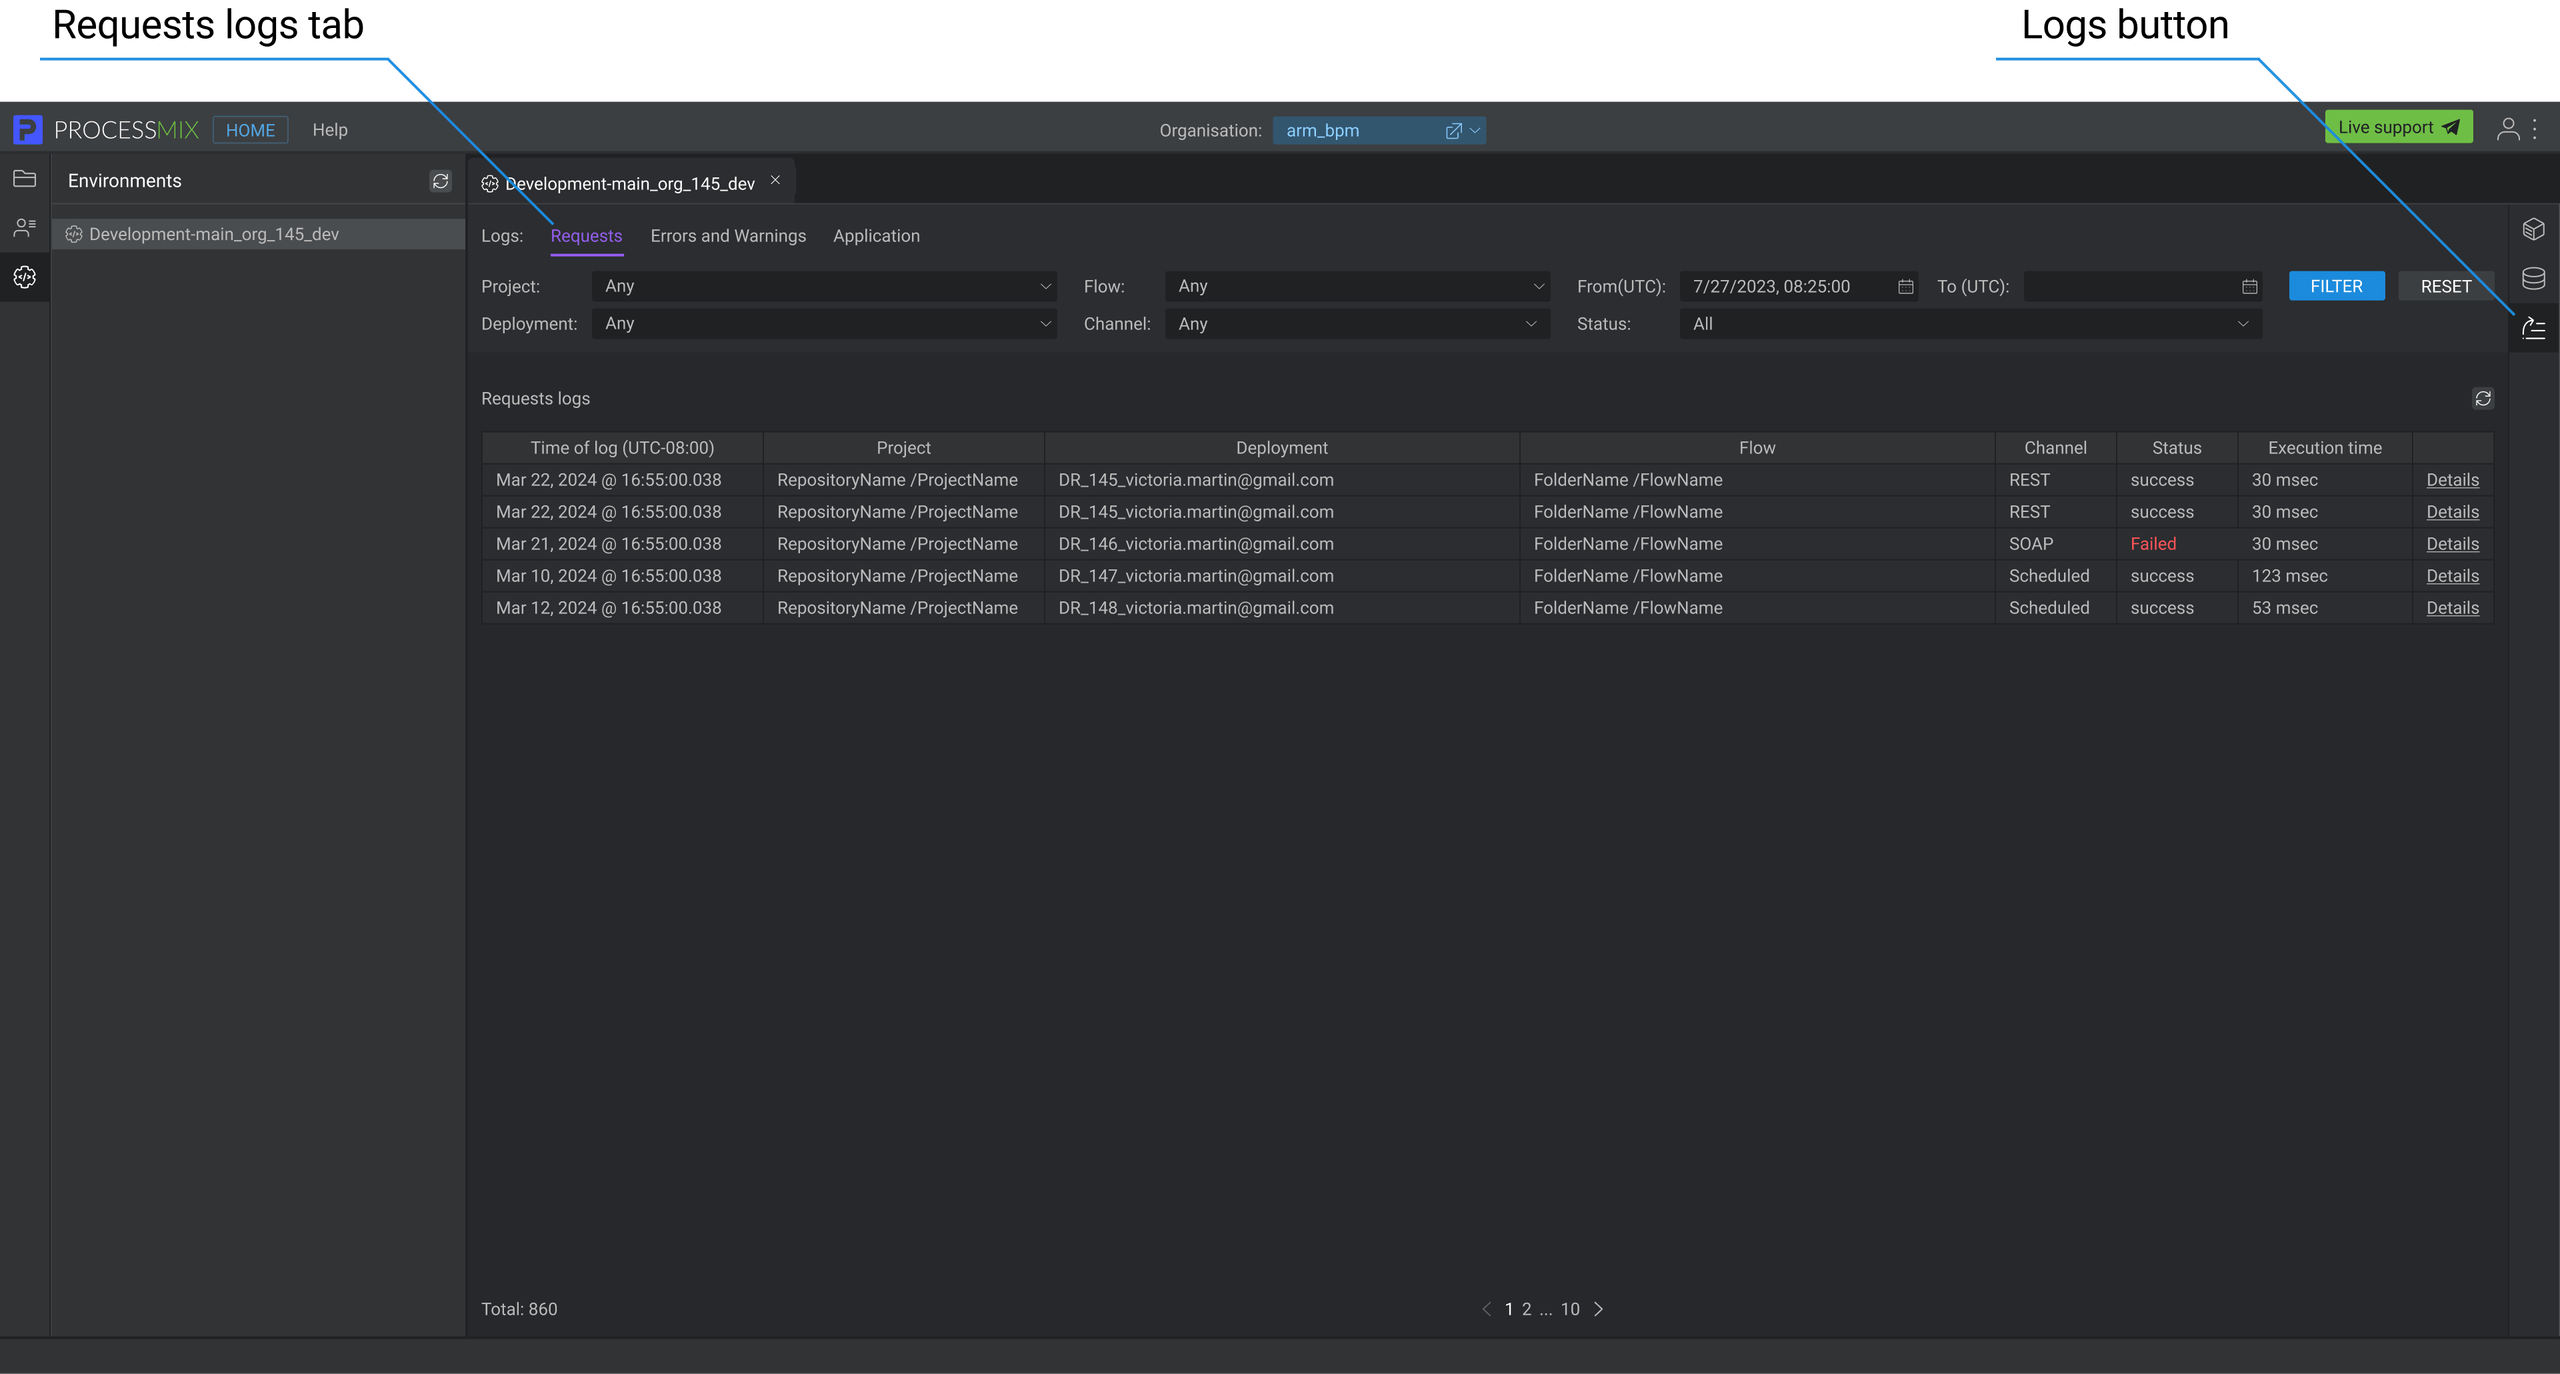
How to navigate to the Requests logs in HOME?
First, select the environment, you need to view the logs. Click the Logs button ![]() in the vertical panel on the right. By default, all results of project calls that have been executed in a particular environment are displayed.
in the vertical panel on the right. By default, all results of project calls that have been executed in a particular environment are displayed.
In STEP 4 of Deployment creation from HOME, the administrator can enable the collection of request logs. By default, this collection is disabled.
During the process of building, compiling, and deploying the environment, you cannot change these settings. Such changes should be made in advance.
How to navigate to the Requests logs in IDE?
The logs panel is presented at the bottom of the left panel on the screen.
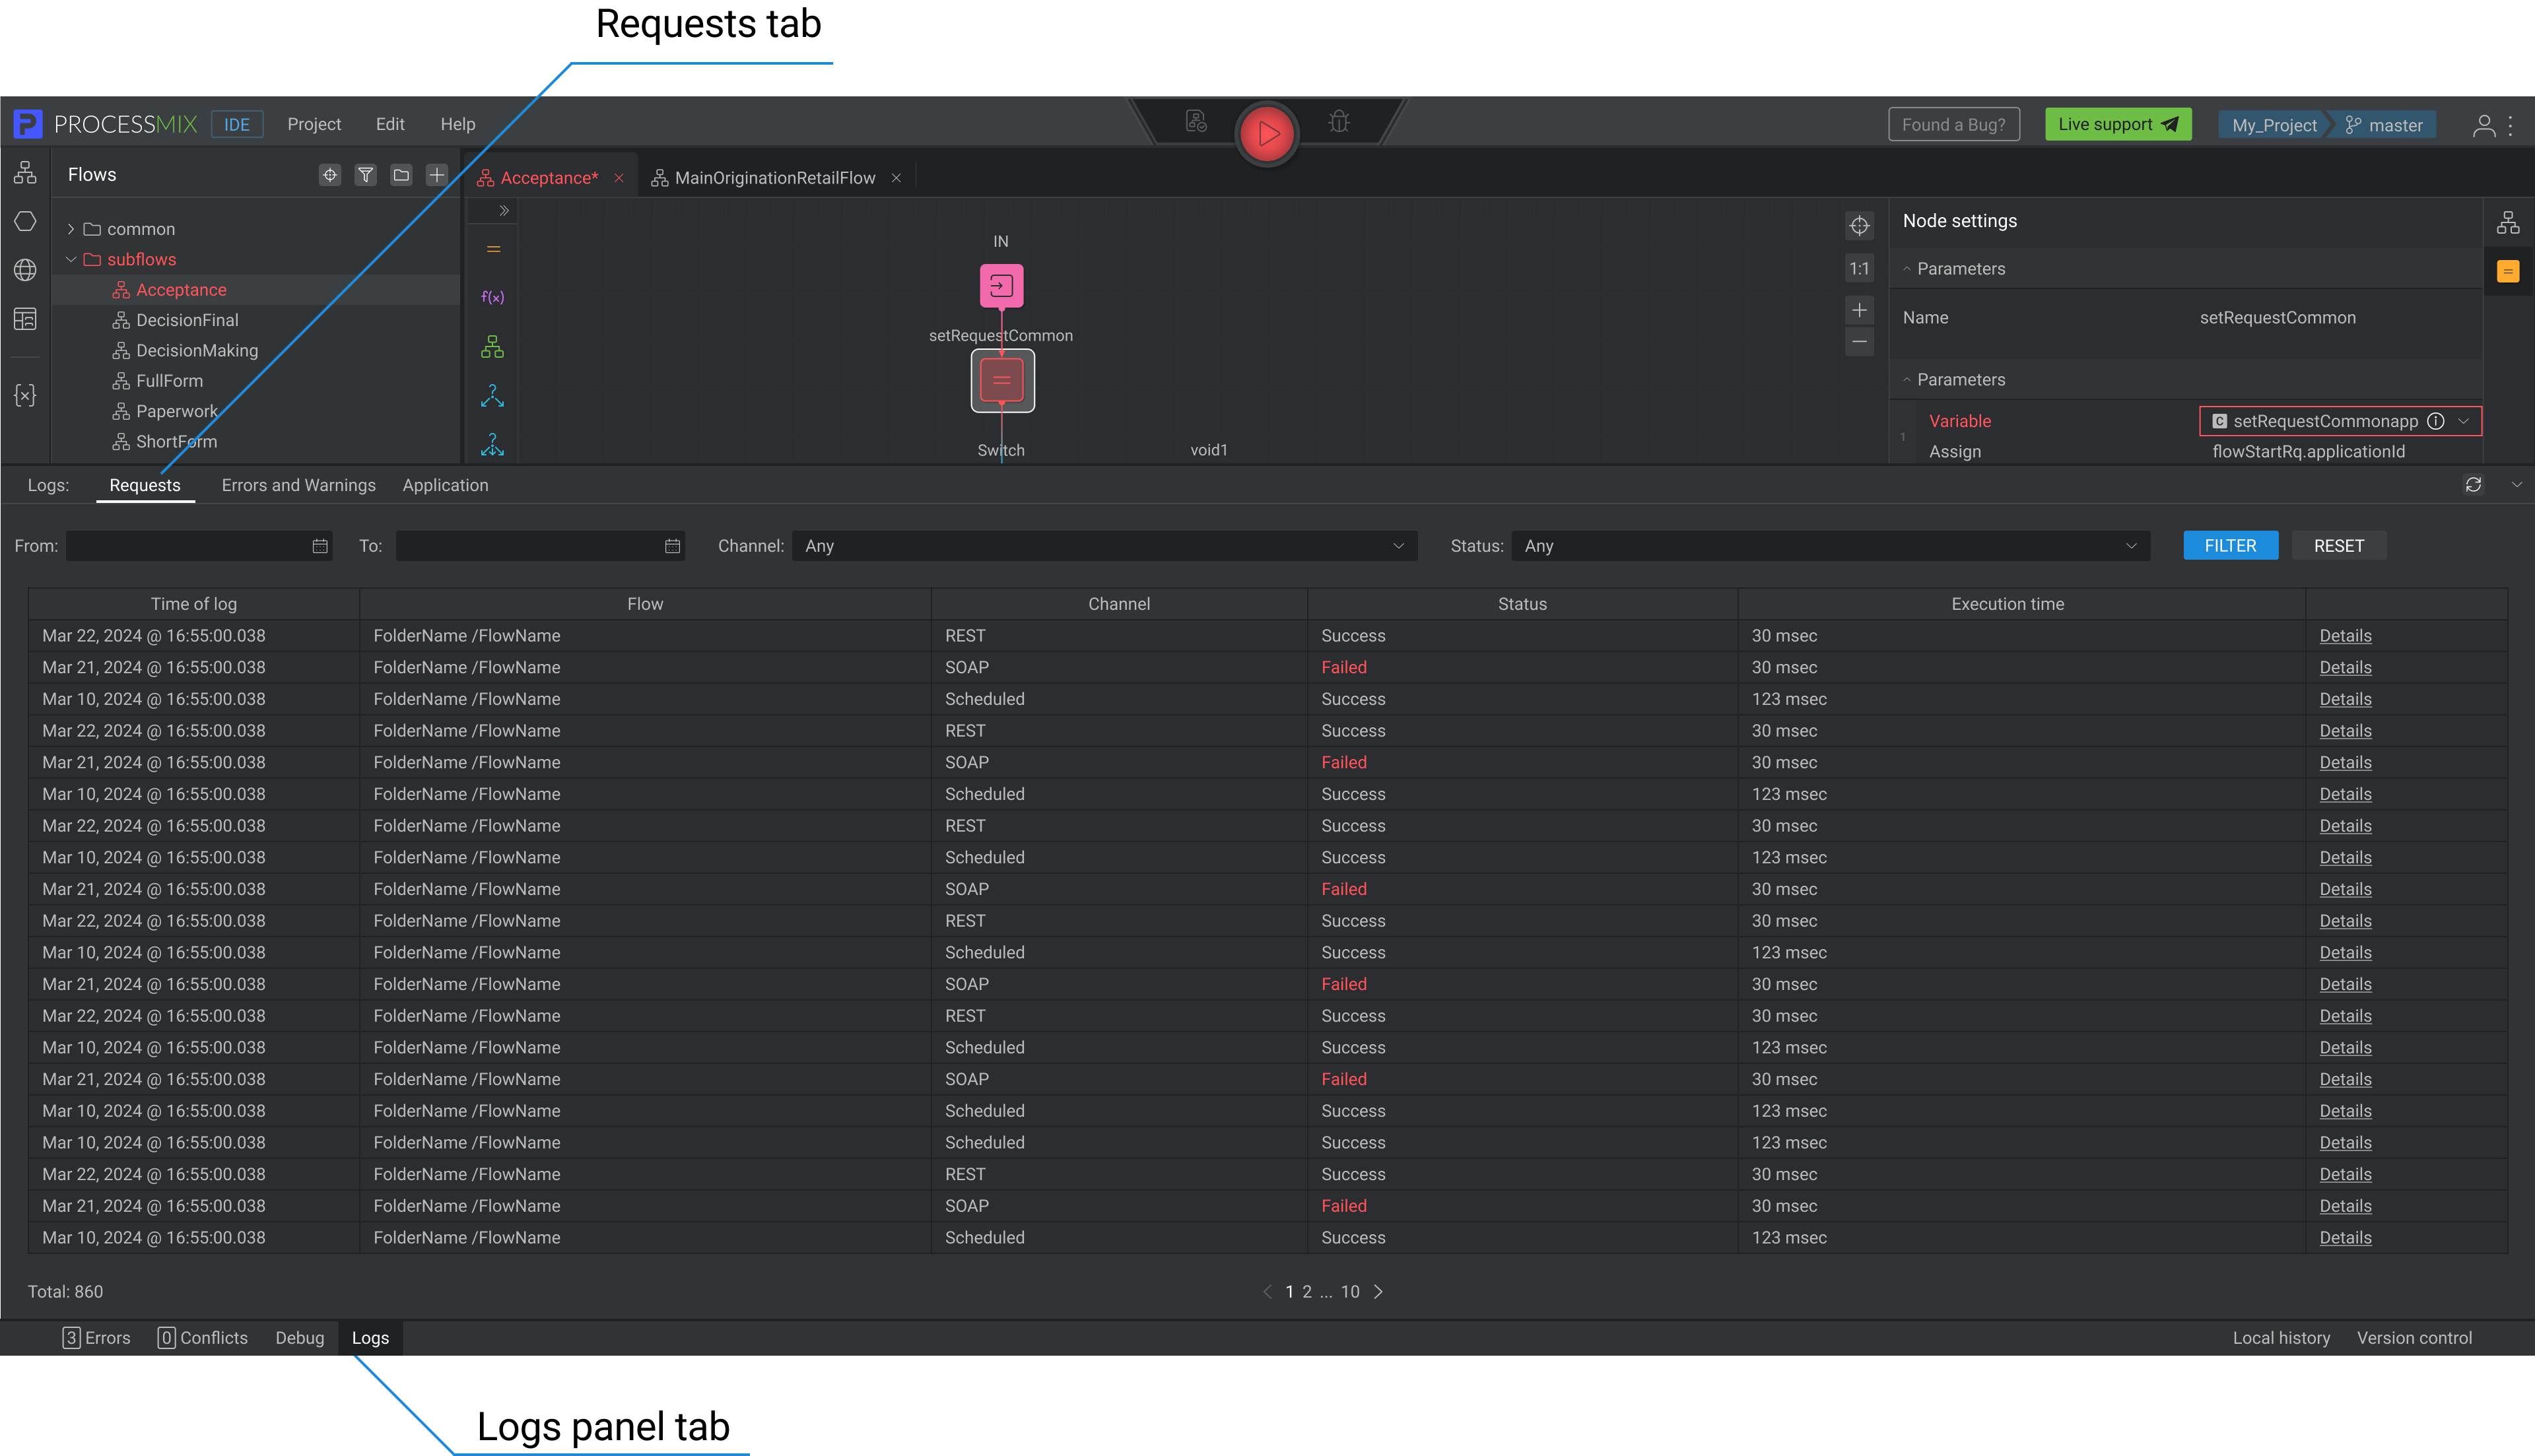
To open the Requests logs panel, click the Logs tab, then the Requests tab located at the top left side of the logs panel. The panel contains all available project logs in the system, such as Requests, Errors and Warnings, and Application. By default, when you navigate to this panel, the Request Logs will be displayed.
Requests Log information includes time of logs, flow, channel, status, execution time, and details. Log details include full log information according to the channel-specific.
To close the Requests logs panel click the Logs tab at the bottom of the screen or use the collapse arrow in the upper right corner of the panel.
How to view the log Details?
Each log entry contains detailed information, the content of which depends on the type of flow channel (REST, SOAP, scheduled).
To view the details, click the Details of the desired log. The system displays a pop-up window with additional information structured according to the REST, SOAP, and Scheduled channels.
Details for the REST channel
Details display full log information:
- Time of Logs. The time when the log was generated.
- Project. The project from which the log originated.
- Deployment. The deployment in which the log appeared.
- Flow. The flow that produced the log.
- URL. The path indicates the requested resource.
- Channel. The type of channel from which the log originated.
- Status. Status indicates whether or not the query was completed successfully.
- error (optional). Text explaining the reason for the error.
- Input block. Comprehensive input information. The format varies based on the flow settings.
- Output. Comprehensive output information. The format varies depending on the type of data transmitted and received.
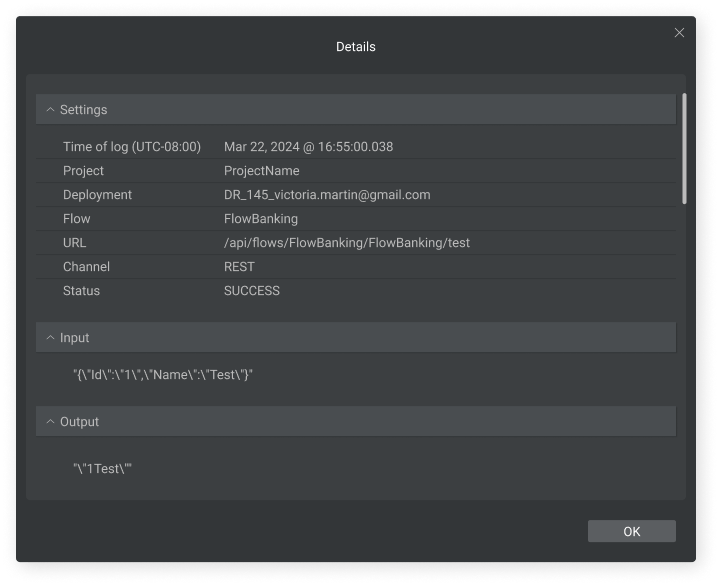
To close the pop-up click ‘OK’ or use the close button ‘X’.
Details for the Scheduled channel
Details display full log information:
- Time of Logs. The time when the log appeared.
- Project. The project from which the log originated.
- Deployment. The deployment in which the log appeared.
- Flow. The flow that produced the log.
- Channel. The type of channel from which the log originated.
- Status. Status indicates whether or not the query was completed successfully.
- error (optional). Text explaining the reason for the error.
- next three runs of the flow: displays when the flow will start next time.
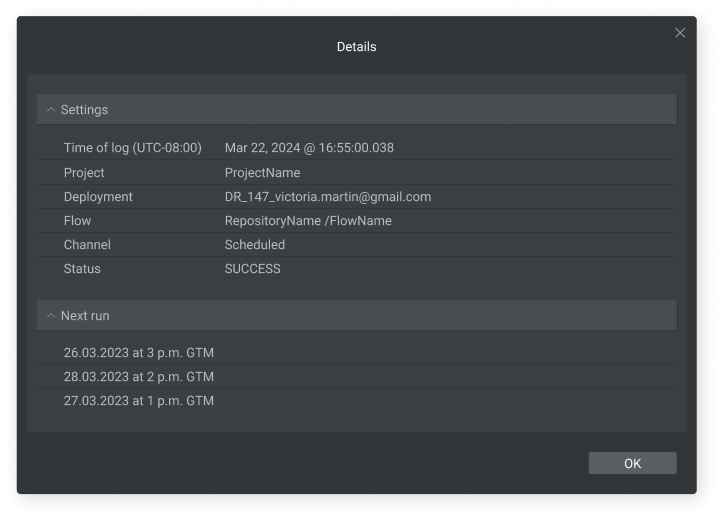
To close the pop-up click ‘OK’ or use the close button ‘X’.
Details for SOAP channel
Details display full log information:
- Time of Logs. The time when the log was generated.
- Project. The project from which the log originated.
- Deployment. The deployment in which the log appeared.
- Flow. The flow where the log appeared.
- Channel. The type of channel from which the log originated.
- Status. Status indicates whether or not the query was completed successfully.
- error (optional). Text explaining the reason for the error.
- Input block. Full input information.
- Output. Full output information.
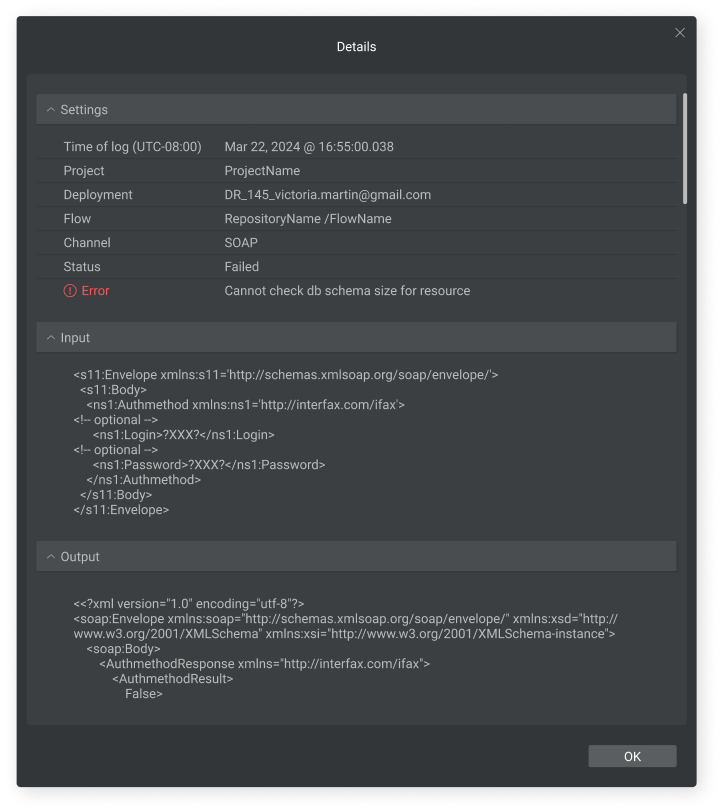
To close the pop-up click ‘OK‘ or use the close button ‘X‘.
How to find the necessary Requests logs?
To filter Requests logs, set the desired parameters and then click the FILTER button. You can filter data by project, deployment, flow, channel, date from, date to, and status in Home. However, in the IDE section, filtering by project, deployment, and flow is not available. Once the filter is applied, the system displays the searched results in the table.
To RESET the filtered results, click the RESET button. This will return the filter values to their default settings.
To refresh the Request logs list, click the Refresh button  . Doing so updates the data, applying the selected filter values during the refresh.