- Development
-
-
- Menu Item
 Visual Development
Build powerful business apps for automation, decision-making, and customer service using an intuitive, visual drag-and-drop interface.
- Data model
Develop data models that support data types of any complexity and structure them in arrays, maps, JSON objects, or other custom data markups.
- Integrations
Utilize the built-in connector builder to seamlessly connect ProcessMIX applications to various databases, REST/SOAP web services, or even blockchain integration.
- Decision Tables
Create complex business logic and handle a large number of rules simultaneously in tabular format.
- Scorecards
Calculate final scores based on the input parameters of certain characteristics to improve your decision-making.
- PMML
Execute existing models based on Predictive Model Markup Language (PMML) to define statistical and data mining models.
- Version control
Facilitate app development with ProcessMIX version control for code change monitoring, history, reversion, and dev team collaboration.
- Debug and test
Streamline your development process by testing and debugging your app's flows while monitoring their performance at each execution breakpoint. Accelerate your development with easy access to application logs within Processmix, facilitating faster troubleshooting and enhancing your overall development efficiency.
- Deploy and use
Quickly deploy REST/SOAP/scheduled apps in the cloud with a single click using ProcessMIX. Benefit from Docker packaging, Kubernetes service, or AWS cloud support. Export projects as JAR/WAR or Java source code for flexibility in utilizing them according to your software development goals.
- Menu Item
-
-
- Solutions
 Visual Development
 Assignment of risk level and customer category within KYC processes at customer onboarding
 Cross-Sell Offer Calculation for the 12M Client Base
Debug
The Debug is the ProcessMIX tool designed to debug the execution of the current flow, view the received values stored in the nodes, examine the flow’s execution path, and troubleshoot problems in the flow’s implementation.
How to work with Debug?
The Debug becomes available only after all errors are fixed, and your project is deployed.
To check the received values in a certain place in the flow, the user needs to select the required node, select the context menu, and select the Add breakpoint. The number of breakpoints in a flow is unlimited.
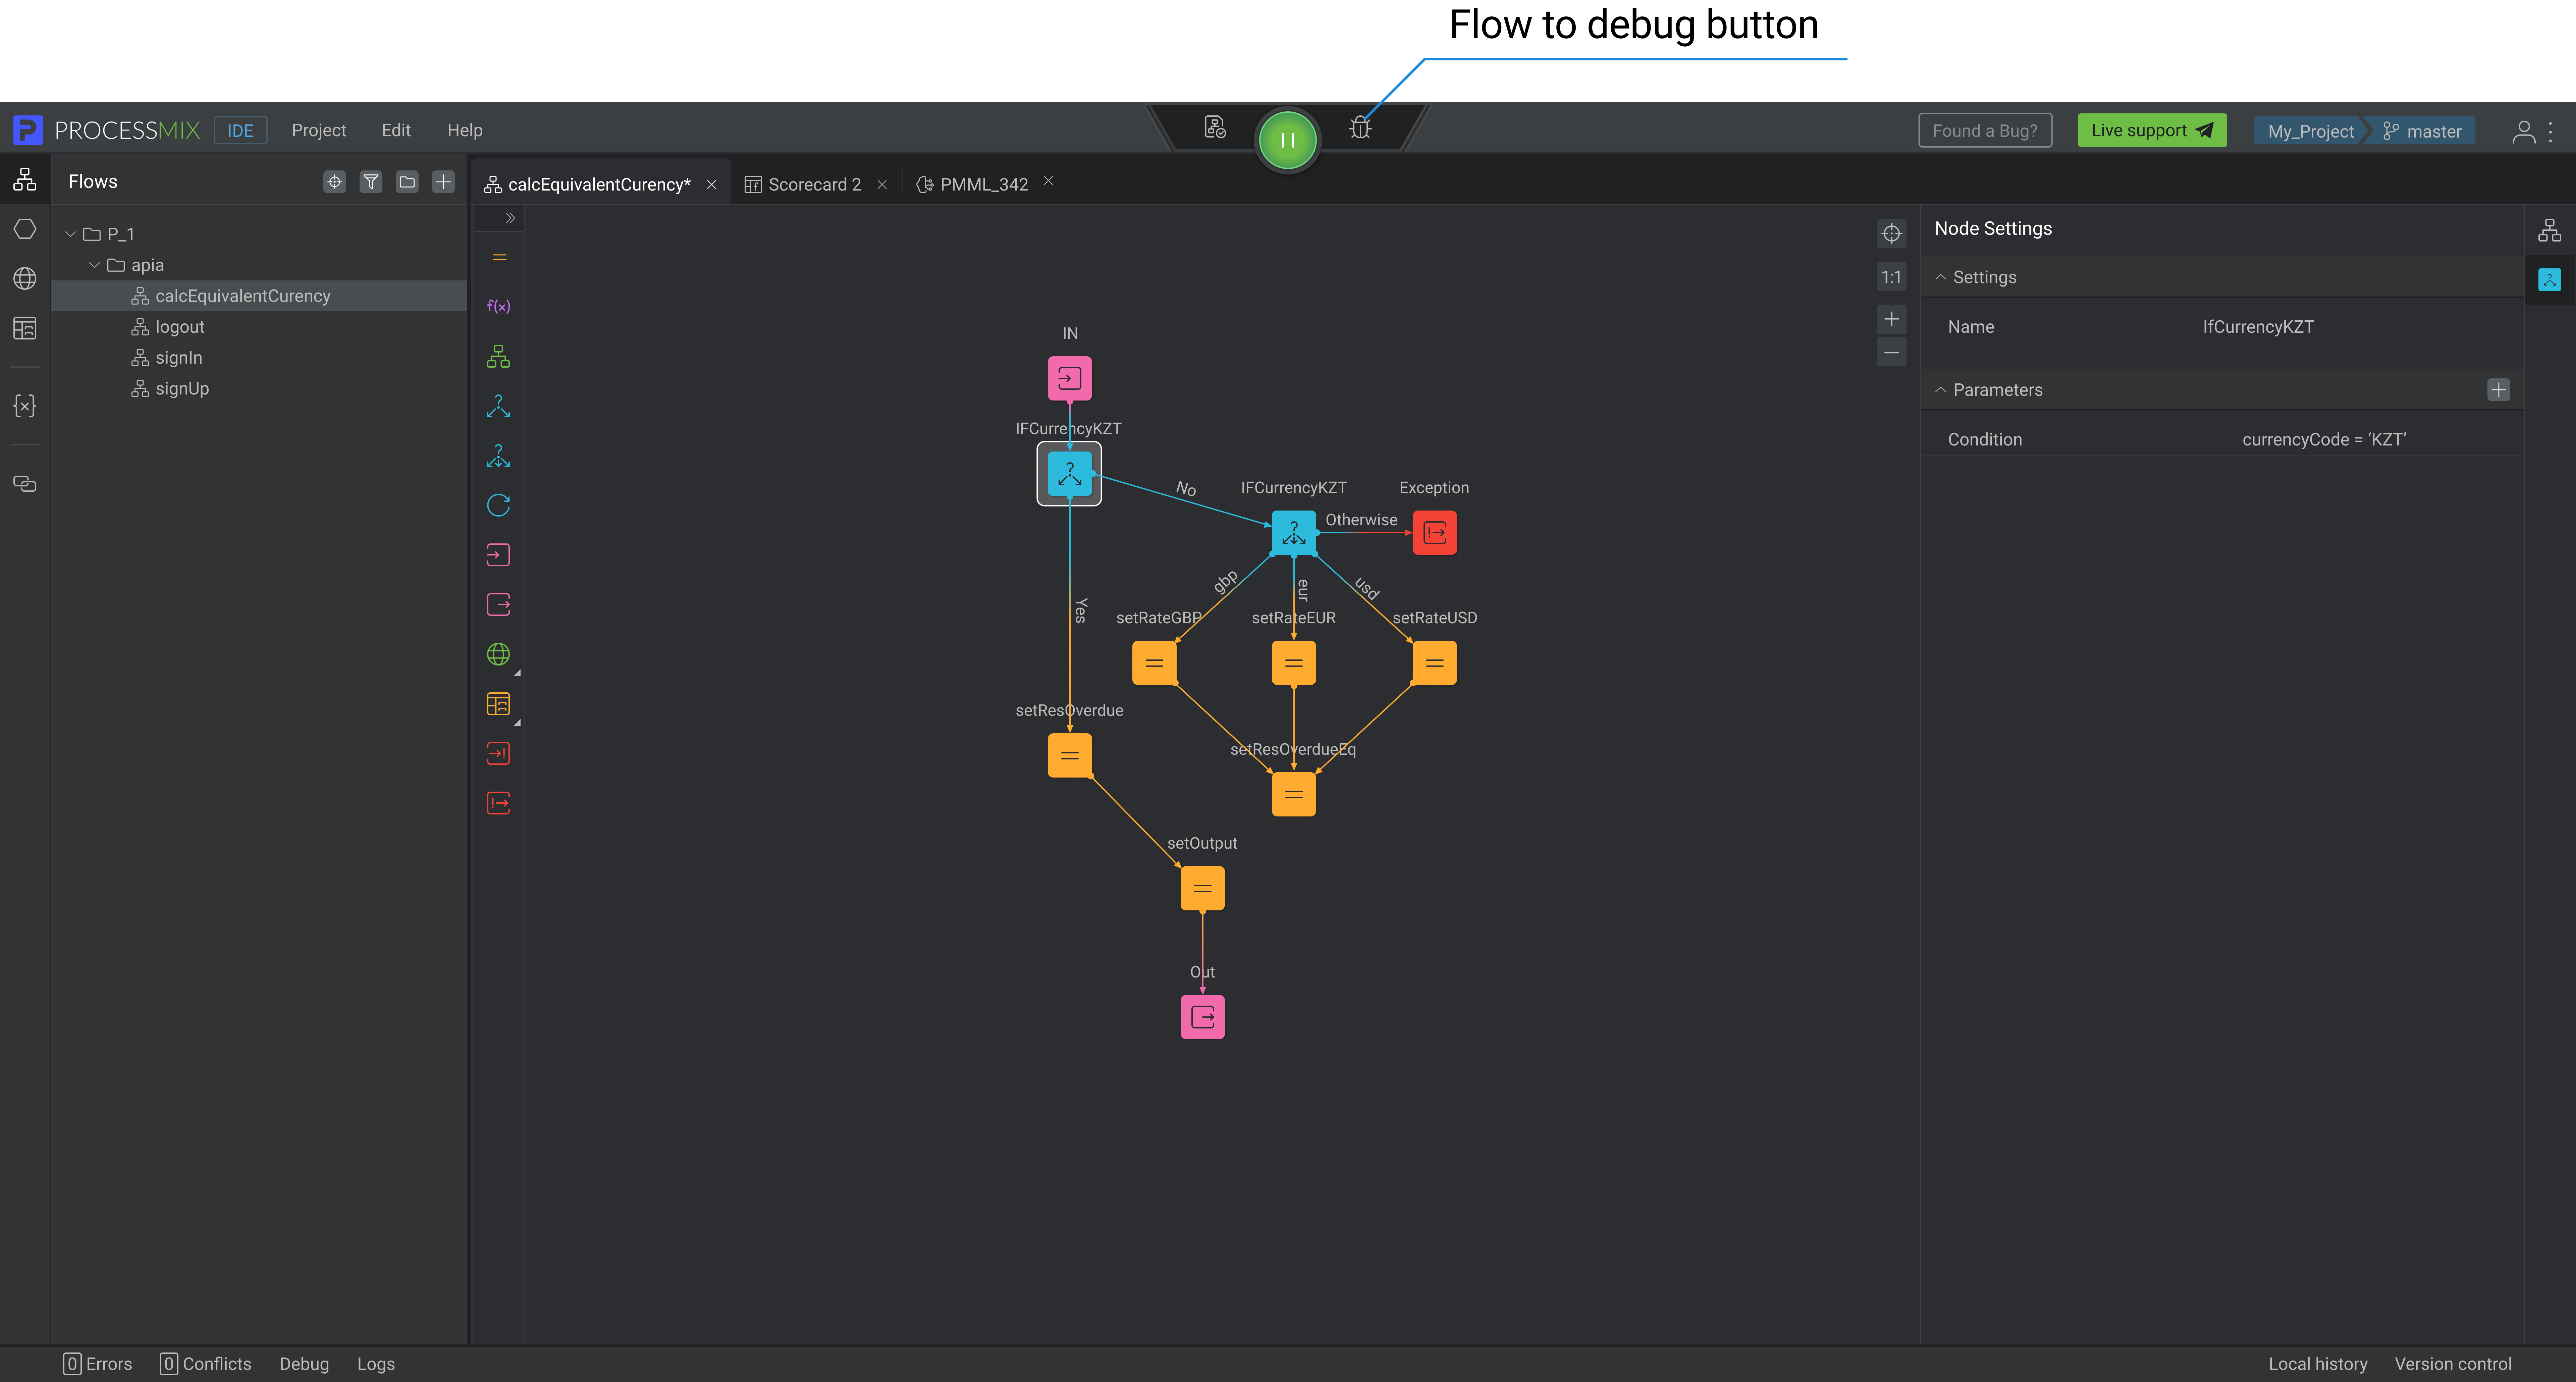
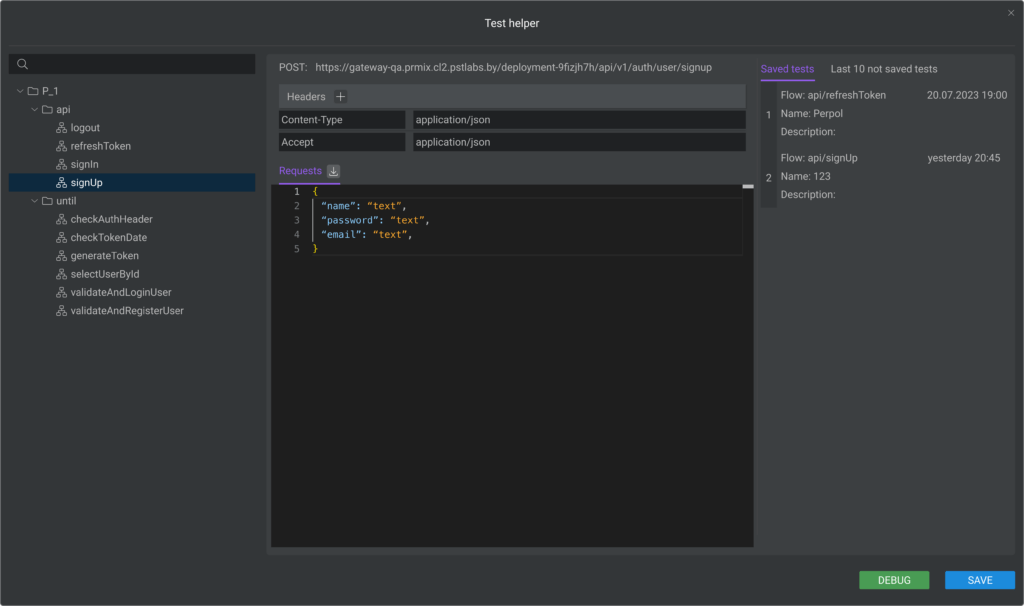
To start debugging, click on the Debug button located to the right of the Project deployment button. The Test Helper pop-up window will open, and all the flows of a deployed project will be displayed on the left. Here you need to select the necessary flow and enter the required values as request parameters and click on the DEBUG button to start the process.
You can use the Download sample  button to get an example of a request that can be used to format or structure a request correctly.
The Download sample button is available only for complex REST flow structures containing elements of different types. For SOAP flow and Subflow, the button is always available.
When debugging requests for all REST flow methods, the Headers are additionally specified. They contain information about the request, such as data format, language, content type, and other settings. The Headers generated automatically from requests cannot be modified.
For example:
- Content-Type: application/json. The application sends the request content as data in JSON format.
- Accept: application/json. The application is waiting for a response in JSON format.
You can add a new header to the existing ones by clicking the Add  button. An additional line will appear in the headers where you specify its name and value.
You can edit and delete headers you have created using the context menu options.
To save the debug test in the browser database click on the SAVE button. In opened pop-up, enter a name and a desctiption of the debug test, and click on the CREATE button. A saved test will be displayed on the left side of the pop up in the “Save tests” tab.
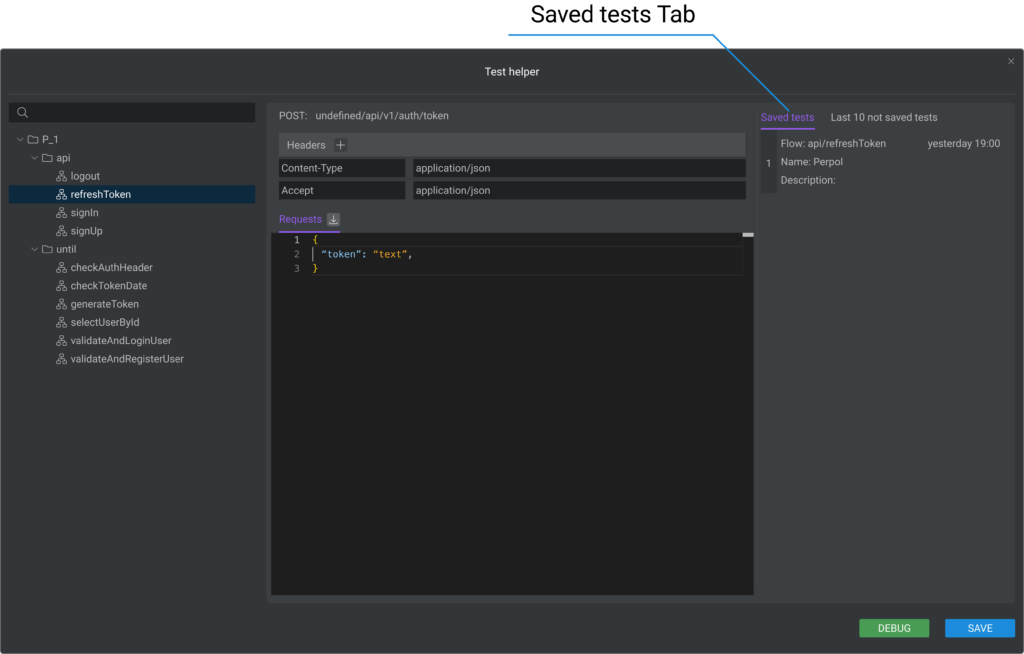
The last 10 unsaved tests are displayed on the left side of the pop up in the “Last 10 not saved tests” tab.
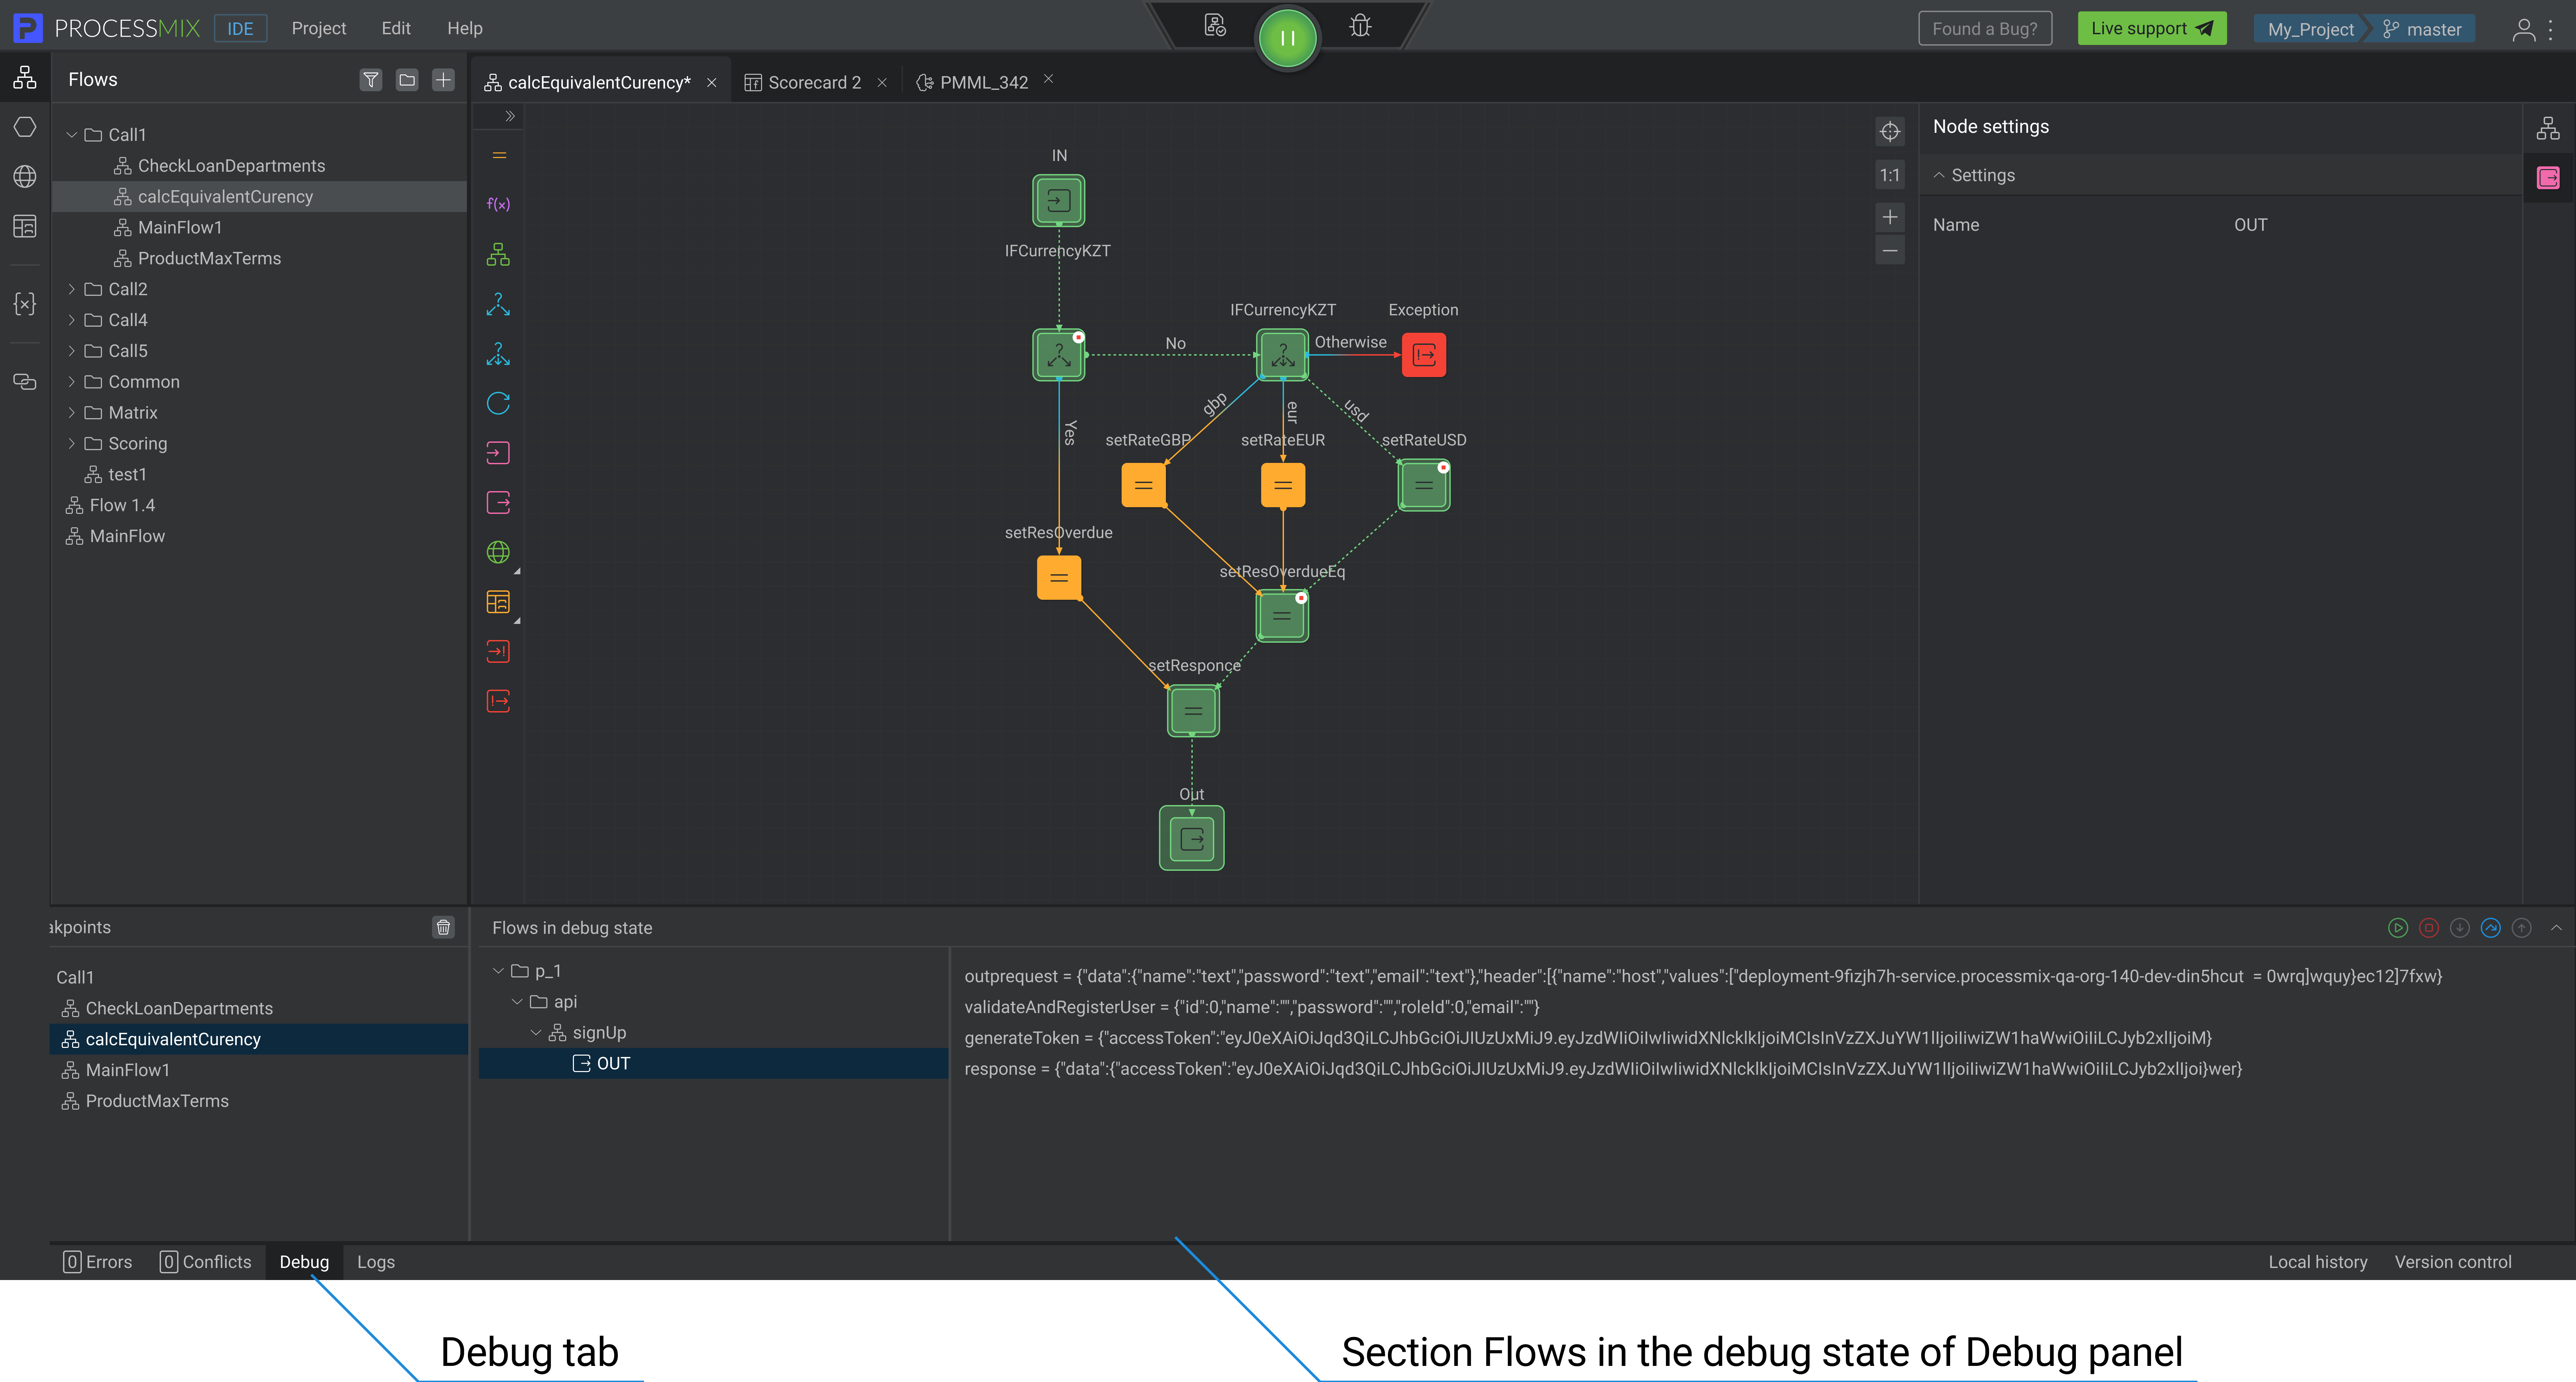
The debugging process started and stopped at the first breakpoint, if there is one. You can see the current value of all variables during the execution of the flow in the Flows in the debug state section. All values can be edited, while debugging that adds flexibility to the process. On the left part of the Flows in the debug state section displays the node where the debug process is stopped. If the user has not added a single Breakpoint, the result of the entire flow is available to him.
You can add additional breakpoints to the flow during the debug process.
Click the Run button on the bottom bar to run part of the flow up to the breakpoint and view the execution result. Also, by pressing this button, the user can execute from the current node to the next breakpoint. If the user is in the last node of the flow, then clicks the Run button, the debug ends.
Also, to complete the debugging, the user can click on the Stop button.
If the user has a subflow node in the flow, the user can switch to the internal flow by clicking on the Step into the button.
There are two ways to remove a breakpoint for a user.
The first way. In the ADE section, select the required endpoint, right-click to go to the context menu, then select Remove breakpoint.
The second way. The bottom panel contains the Breakpoints section. To do this, to delete all breakpoints, the user needs to click on the Delete  button.