- Development
-
-
- Menu Item
 Visual Development
Build powerful business apps for automation, decision-making, and customer service using an intuitive, visual drag-and-drop interface.
- Data model
Develop data models that support data types of any complexity and structure them in arrays, maps, JSON objects, or other custom data markups.
- Integrations
Utilize the built-in connector builder to seamlessly connect ProcessMIX applications to various databases, REST/SOAP web services, or even blockchain integration.
- Decision Tables
Create complex business logic and handle a large number of rules simultaneously in tabular format.
- Scorecards
Calculate final scores based on the input parameters of certain characteristics to improve your decision-making.
- PMML
Execute existing models based on Predictive Model Markup Language (PMML) to define statistical and data mining models.
- Version control
Facilitate app development with ProcessMIX version control for code change monitoring, history, reversion, and dev team collaboration.
- Debug and test
Streamline your development process by testing and debugging your app's flows while monitoring their performance at each execution breakpoint. Accelerate your development with easy access to application logs within Processmix, facilitating faster troubleshooting and enhancing your overall development efficiency.
- Deploy and use
Quickly deploy REST/SOAP/scheduled apps in the cloud with a single click using ProcessMIX. Benefit from Docker packaging, Kubernetes service, or AWS cloud support. Export projects as JAR/WAR or Java source code for flexibility in utilizing them according to your software development goals.
- Menu Item
-
-
- Solutions
 Visual Development
 Assignment of risk level and customer category within KYC processes at customer onboarding
 Cross-Sell Offer Calculation for the 12M Client Base
Application logs
The Application Logs panel displays events, errors, and the state of the application compiled in the system.
Application logs are available to owners, administrators, as well as project users who have permission to deploy the project.
-
For organizations with the Free plan, this option is unavailable from HOME.
-
The Application Logs section is available in the IDE for all users, regardless of their role and organization subscription plan. In the IDE, you can access the Application Logs section to view the logs specific to the project you are currently working on.
How to Work with the Application Logs Panel in HOME?
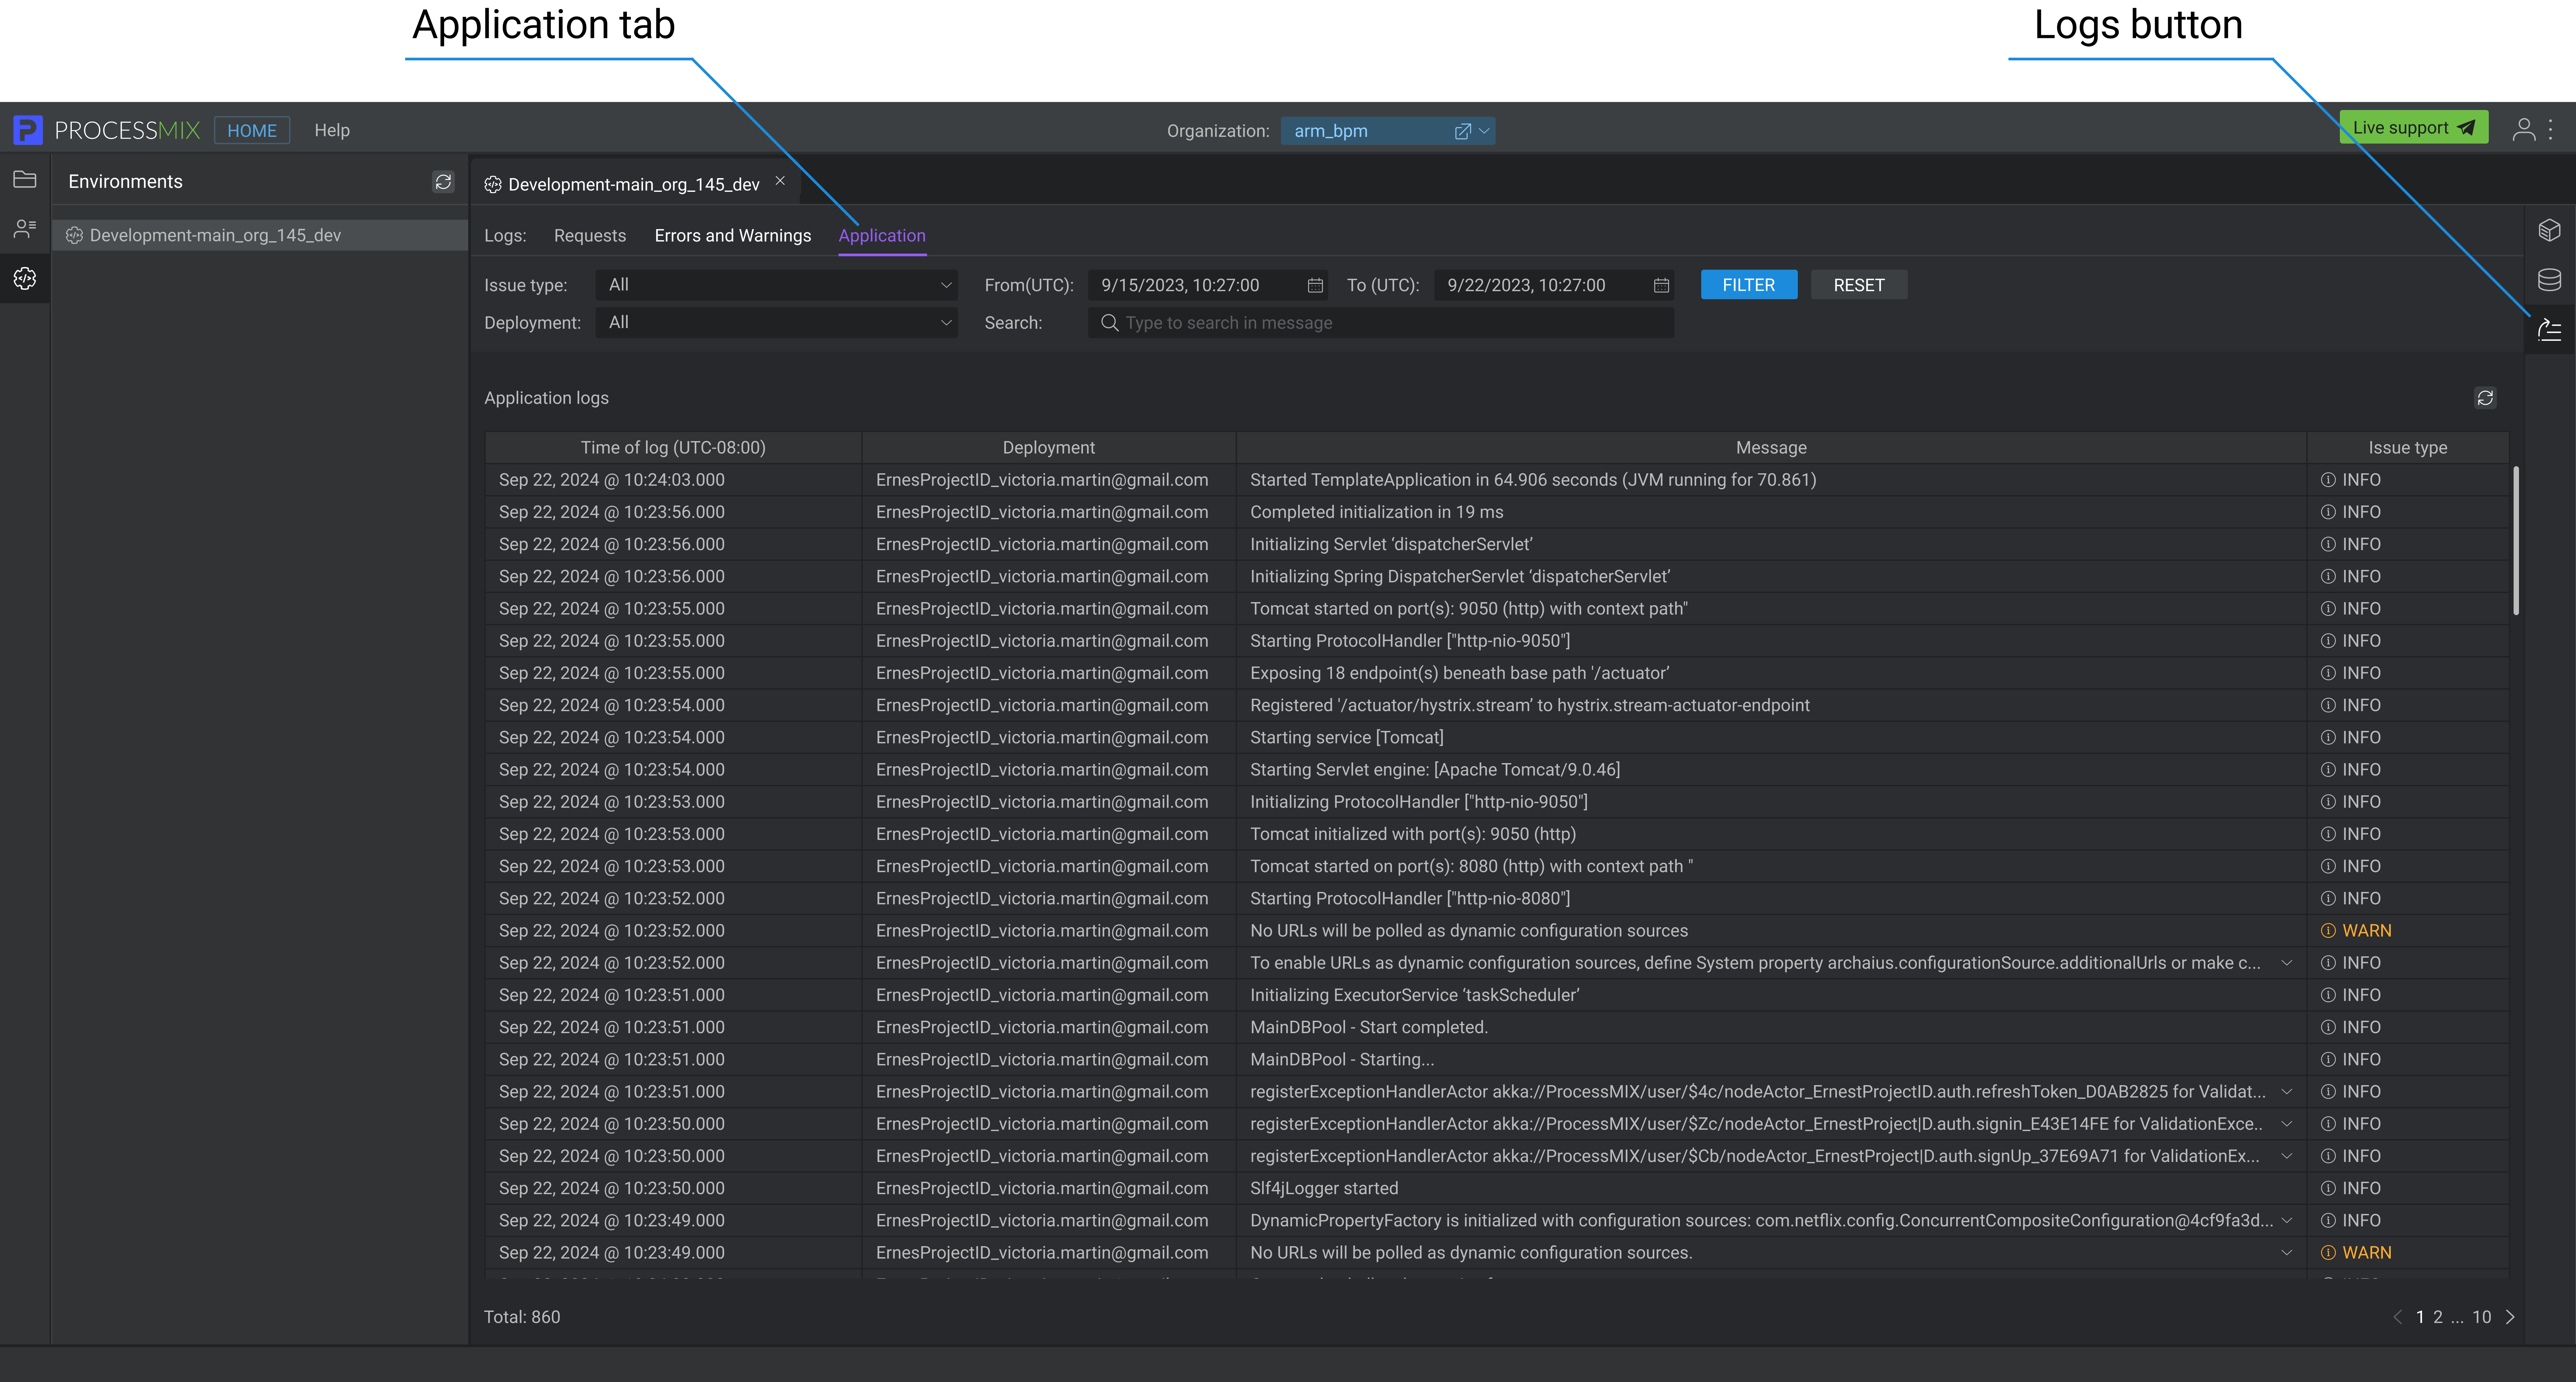
In the HOME, you can view Аpplication logs for all deployments based on the selected environment. To do this, select the desired environment, click the Logs button in the vertical panel on the right, and then navigate to the Application tab.
Application logs are available after the deployment of the project is completed.
To filter Application logs to find the necessary logs. You can select the desired data by clicking the FILTER button. You can filter data by issue type, deployment, date from, and date to. When the filter is applied, the system will display the search results in the table.
By default, the list of logs is sorted and displayed according to date and time, with the latest date/time displayed first.
You also can search logs to find the necessary logs. The search for logs is carried out by message.
To refresh the Application logs list click the Refresh button. This action updates the data.
Clicking the RESET button reverts the filter values to their default settings.
How to Work with the Application Logs Panel in IDE?
The panel is located at the bottom left of the screen. To access the Errors panel, click the Logs tab. Logs displayed relate to the most recent deployment.
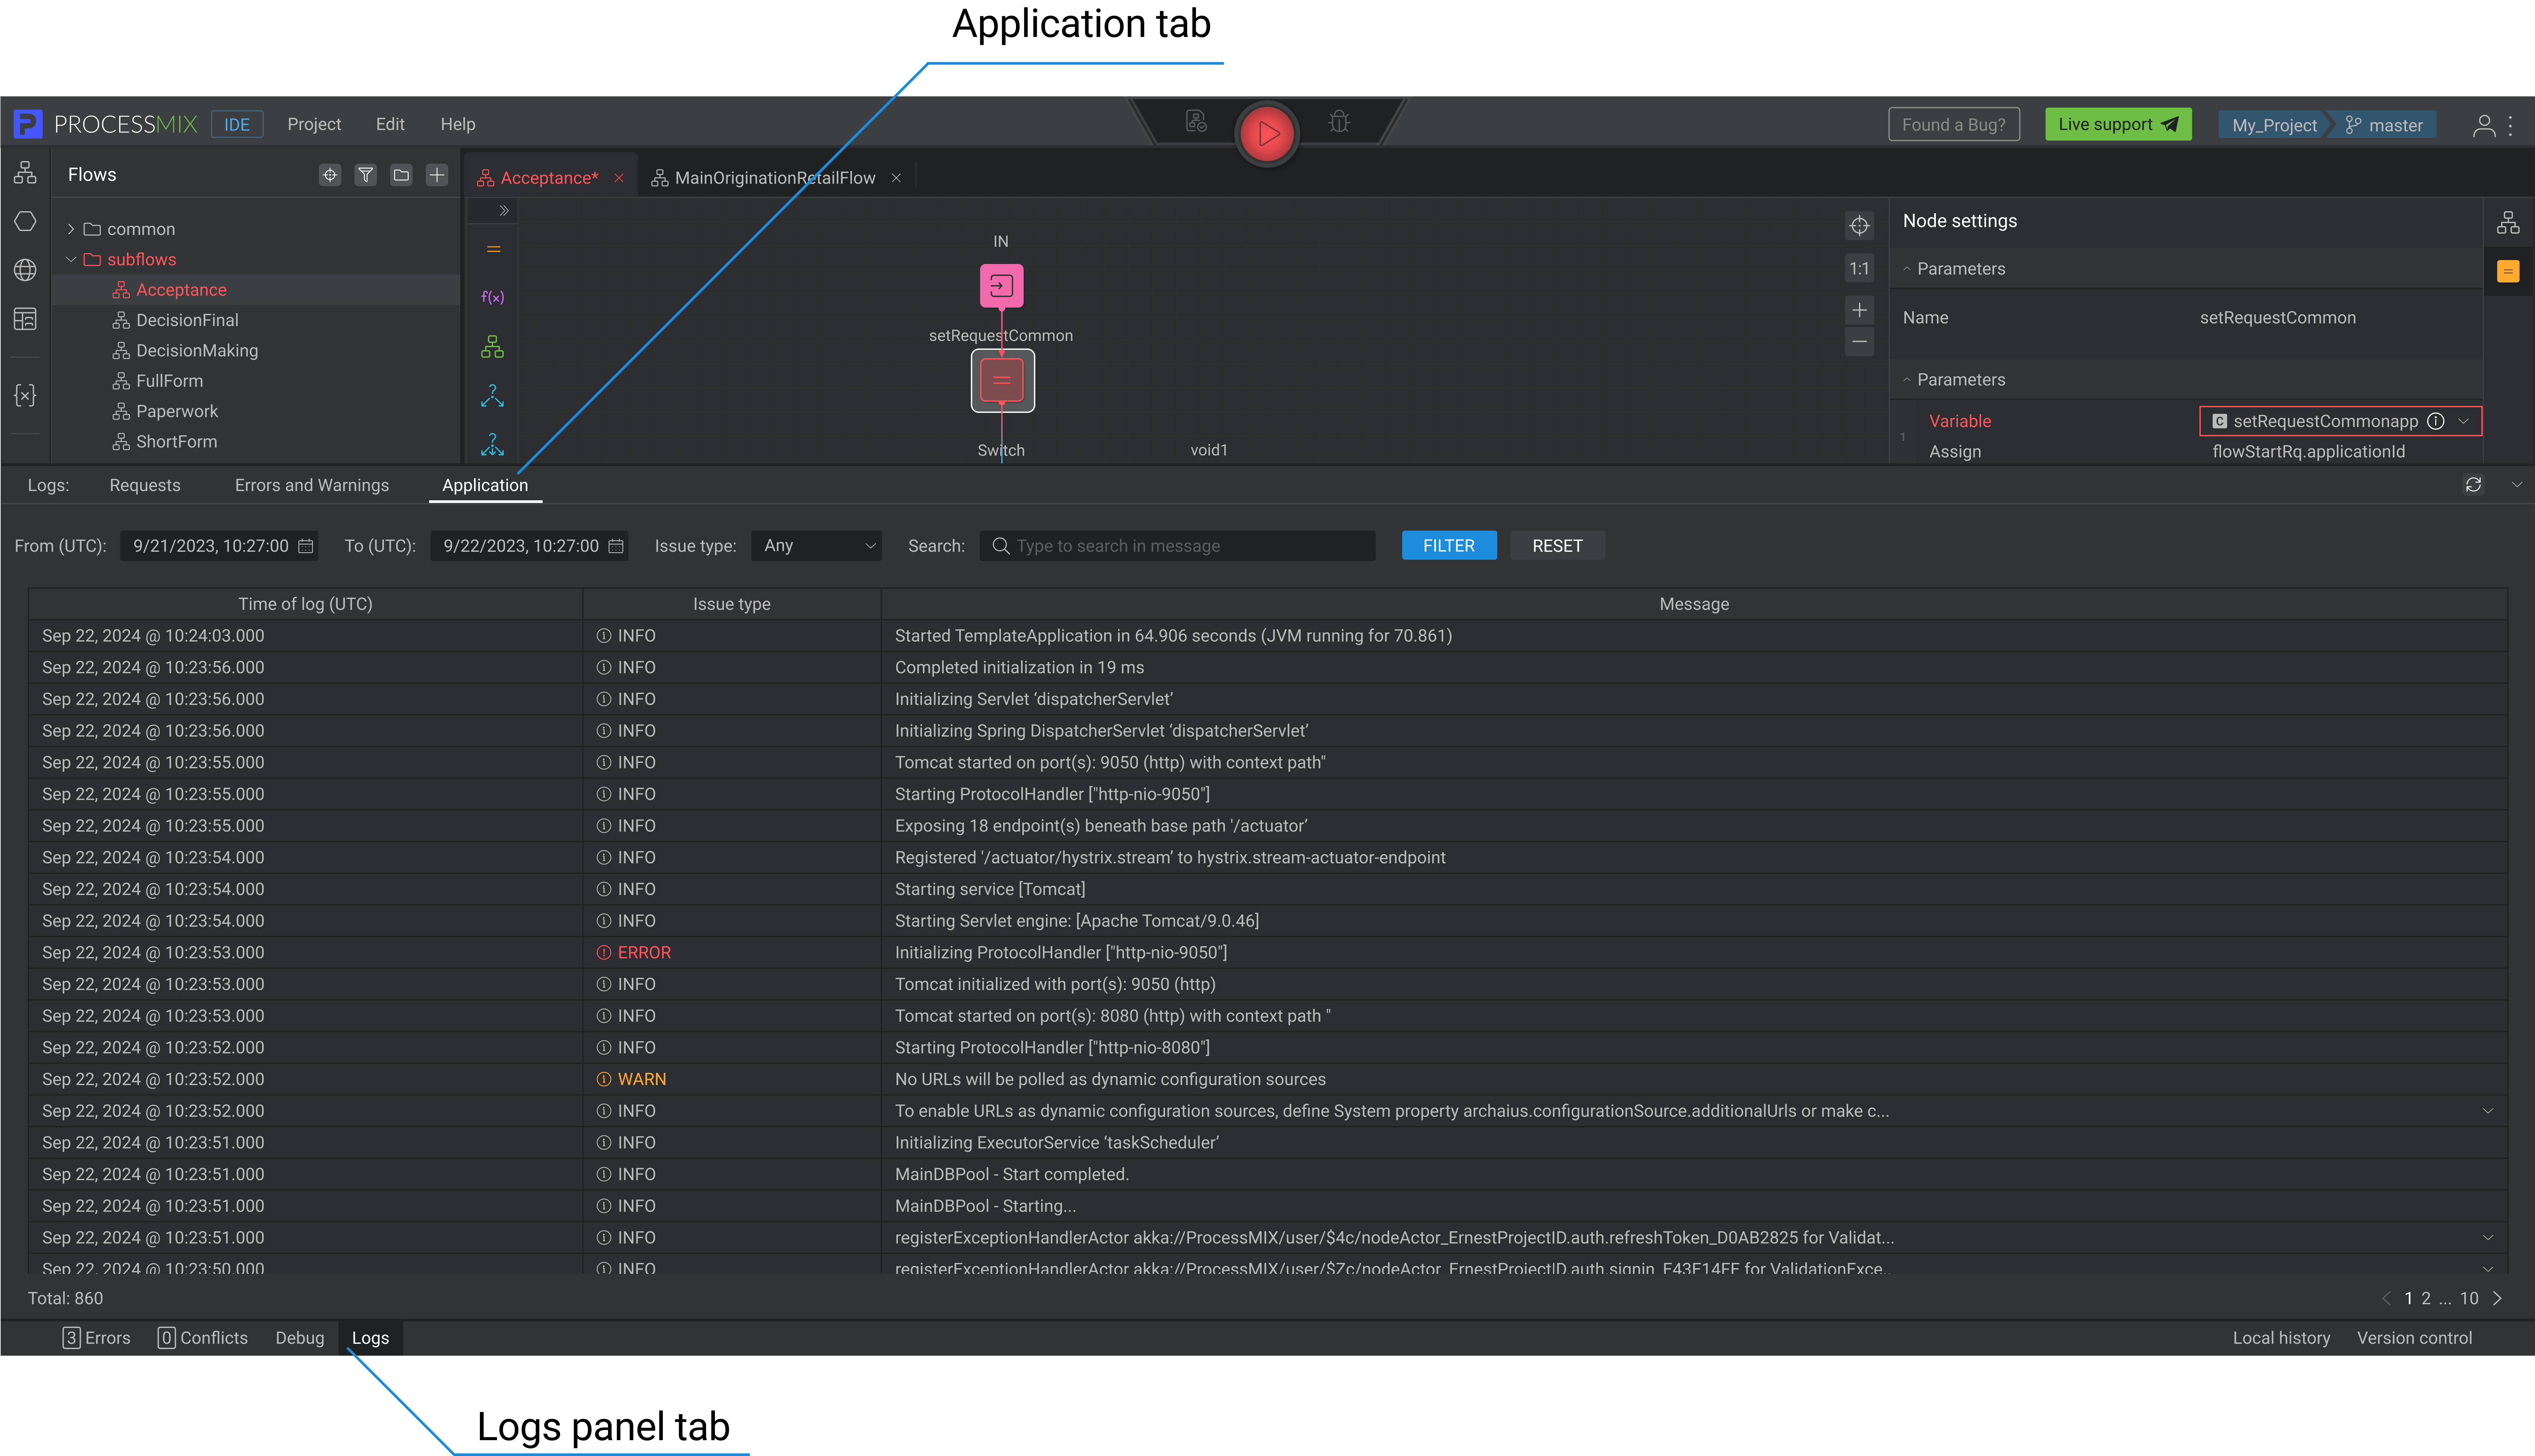
The logs panel has three tabs. Select “Application”
Log information includes the Time of Logs, Issue type, and Message. Logs are divided into pages. The pages are viewed through the paginator (without scrolling).
To filter the Application logs to find specific logs, set the desired parameters and click the FILTER button. Once the filter is applied, the system will show the search results in a table.
You can also search within the logs message to find relevant entries.
To refresh the Application logs list, click the Refresh  button. This action will update the data.
Clicking the RESET button will revert the filter values to their default settings.
To close the Application panel, click the Logs tab at the bottom of the screen or use the collapse arrow in the upper right corner of the panel.